Operational highlights
Title | Highlight commentary |
|---|---|
Welcome ACTAS to the AIS Campus | The ACT Academy of Sport (ACTAS) was welcomed to the AIS campus. The ACTAS Strength and Conditioning Gym re-located to the Sports Training Facility in October 2016 and following an extensive fit-out their administrative offices re-located from Lyneham in June 2017. |
Establishment of NBA Global Academy at the AIS Campus | Following agreement between the AIS, Basketball Australia and the National Basketball Association (NBA), the NBA Global Academy was established at the AIS Campus. The Academy is a pathway to the NBA for selected 17 and 18 year old players from various countries and Australia. The Academy takes advantage of the world-class basketball facilities and services at the AIS and was officially opened in June 2017. |
| Gas Contract Renewal | The ASC major user gas contract was negotiated in conjunction with a number of Canberra’s Commonwealth Cultural Institutions and was awarded to Origin Energy for the next five years. This contract provides certainty of costs during its term and will provide significant savings to the ASC during a volatile period in the Australian gas market. |
Site management
The ASC continued to maintain and enhance facilities at the AIS campus, Bruce, in support of high performance NSO programs and participation. Fourteen sports have entered into
facilities agreements with the ASC to operate from the Bruce Campus for the next four years. The Australian Sports Foundation (ASF) and ACTAS also have active facilities agreements for operations at this site.
In addition, the ASC operates strategic sports training facilities at Pizzey Park on the Gold Coast (two NSO facilities agreements) and at the AIS European Training Centre in Italy. Rowing Australia operates from a purpose-built facility at Yarralumla, fronting Lake Burley Griffin in Canberra, under a lease arrangement.
The campus is also used by a variety of community, sporting and commercial groups and is a popular national attraction for visitors.
In support of sports participation, Sporting Schools continued to operate from leased premises in Brisbane, Sydney, Melbourne, Adelaide and Perth. Offices in Darwin, Cairns and Hobart operated for part of the year and have now closed following changes to the program’s operating model.
The ASC undertook many key refurbishment and enhancement projects to provide high- quality training, testing and athlete servicing facilities in support of NSO programs. Significant projects included:
- AIS Basketball and Netball Centre — commencement of external cladding replacement, air-conditioning system upgrade and re-configuration of the mechanical plant pods
- AIS Athletics Track and Field Centre — a new entry gate and fence, improved swipe access system for wheelchair athletes and a maintenance and warm-up shed for wheelchair athletes
- AIS Aquatic and Fitness Centre — replacement of the southern grand-stand in the 50m pool, construction of new storage sheds, concrete repairs, tiling of the wet corridors in preparation for tiling of the entire pool surrounds in 2017–18, refurbishment of the lifeguard office and de-commissioning of the spa and plunge pools
- Grass fields — replacement of turf on the playing surface of two multi-purpose fields, improvements to field surrounds including footpaths and access road
- AIS High Performance Centre — extension to the building to provide a workshop to house a new 5-axis milling machine
- Athletes Village — fit-out of new office space for ACTAS
- Sports Training facility — upgrading of lighting and audio-visual equipment within the Charlesworth Theatrette
- Multi-Sport Facility — replacement of specialist floor covering in Strength and Conditioning
- AIS Visitor Centre — completion of the upgrade and replacement of a number of the exhibits in the Sportex interactive sporting exhibition
- Storage Units — a new nine bay storage shed was constructed at the northern carpark for allocation to NSO’s for additional storage
- Yarralumla, ACT — replacement of one pontoon for Rowing Australia
- Chandler, Qld — new office fit-out for Diving Australia.
Environment and heritage
The ASC Environmental Sustainability Policy was revised in March 2016 and is based on the International Standard for Environmental Management Systems (ISO 1401:2015). The Policy outlines the ASC’s commitment to sustainable development and to minimising the impact of our operations on the environment.
Throughout 2016–17, the ASC continued to monitor its energy and water usage and progressed specific environmental initiatives highlighted in 2015–16. Key activities and achievements included:
- continued implementation of the lighting upgrade program to install energy efficient LED lighting and improve lighting control systems
- implementation of a 65/35 split for recycling and general waste bins within all work areas on the AIS campus
- maintaining two cardboard recycling stations to provide a high-value uncontaminated recycling stream which reduced cardboard waste by 18 cubic metres a week
- continued operation of the organic waste recycling program, with an increase of 10 per cent, or an average of 1,000 kg, of organic waste, being channeled through the ASC’s four worm farms each week
- the introduction of AIS branded ‘worm juice’, a bi-product of the worm farms, which is now used as a substitute for some commercial-grade fertilisers within the ASC horticulture program
- being presented with the 2017 Excellence Award for the ASC worm farm initiative as part of the ACTSmart Business Sustainability Awards program
- water and gas usage remaining relatively constant while there was a gradual reduction in electricity use.
The ASC has continued to enhance its capability to identify and manage its buildings and artefacts of heritage or cultural significance. In 2016–17 the ASC has:
- continued operation of the ASC Heritage and Culture Committee (HACC) to oversee the ASC’s heritage commitments
- developed criteria for borrowing and receiving donated memorabilia from members of the public
- received Heritage Reports for:
- Gymnastics Centre (Building 12)
- Basketball and Netball Centre (Building 13)
- Combat Centre (Building 14)
- commenced work on an online AIS Scholarship Holders Alumni history. One sport has been completed and is available online — clearinghouseforsport.gov.au/people/ais_alumni/swimming
- catalogued an additional 27 items for a total of 308 items in the ASC Heritage catalogue
- held the ASC’s first ANZAC Day Memorial Service at the commemorative Aleppo pine that was planted in 2016
- created a draft of ‘Reflect’ Reconciliation Action Plan for submission to Reconciliation Australia.
No property with heritage values was acquired or disposed of during 2016–17.
Electricity consumption
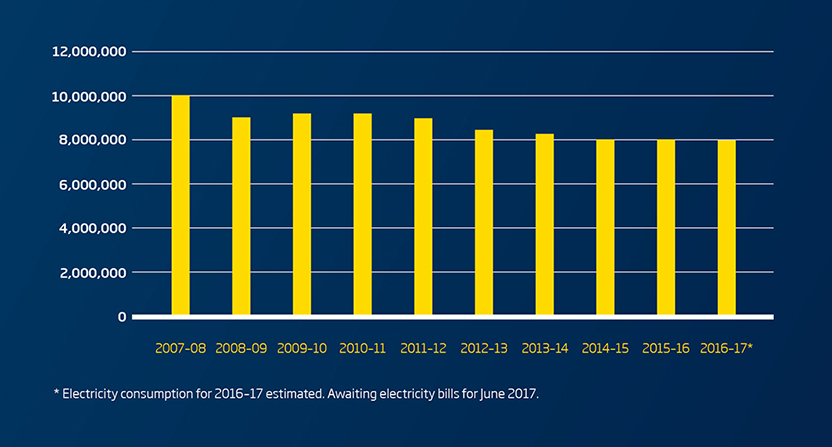
| 2007-08 | 2008-09 | 2009-10 | 2010-11 | 2011-12 | 2012-13 | 2013-14 | 2014-15 | 20015-16 | 2016-17* | |
|---|---|---|---|---|---|---|---|---|---|---|
| July | 955,380 | 861,527 | 850,727 | 856,942 | 842,078 | 794,350 | 796,047 | 755,613 | 766,564 | 717,714 |
| August | 912,214 | 781,114 | 824,508 | 863,954 | 810,199 | 775,944 | 780,773 | 716,241 | 706,761 | 722,584 |
| September | 824,539 | 688,117 | 732,051 | 766,169 | 765,075 | 699,688 | 662,479 | 676,715 | 654,826 | 625,893 |
| October | 856,854 | 705,551 | 757,202 | 724,827 | 748,314 | 684,474 | 666,965 | 642,180 | 624,307 | 599,512 |
| November | 872,966 | 698,596 | 783,492 | 739,305 | 775,516 | 692,496 | 644,679 | 648,243 | 634,270 | 603,032 |
| December | 812,398 | 666,446 | 723,571 | 690,127 | 660,639 | 659,158 | 638,550 | 641,159 | 693,674 | 622,393 |
| January | 914,166 | 788,038 | 811,601 | 734,519 | 750,022 | 748,605 | 735,134 | 680,684 | 686,850 | 686,973 |
| February | 794,147 | 706,563 | 717,851 | 723,287 | 722,121 | 677,231 | 663,523 | 647,725 | 672,436 | 624,793 |
| March | 797,518 | 738,895 | 745,919 | 754,334 | 705,265 | 686,668 | 674,045 | 678,261 | 651,420 | 662,813 |
| April | 766,760 | 718,708 | 670,010 | 687,947 | 694,246 | 636,157 | 602,091 | 627,616 | 595,784 | 586,734 |
| May | 795,194 | 838,021 | 784,870 | 802,709 | 785,436 | 701,585 | 680,523 | 699,996 | 655,177 | 670,274 |
| June | 778,649 | 826,107 | 831,267 | 824,195 | 804,459 | 712,591 | 703,901 | 698,889 | 702,745 | 702,745 |
| Annual Electricity Consumption | 10,080,785 | 9,017,683 | 9,233,069 | 9,168,315 | 9,082,355 | 8,468,947 | 8,248,710 | 8,113,323 | 8,044,813 | 7,825,460 |
* Electricty consumption for 2016-17 estimated. Awaiting elctricity bills for June 2017.
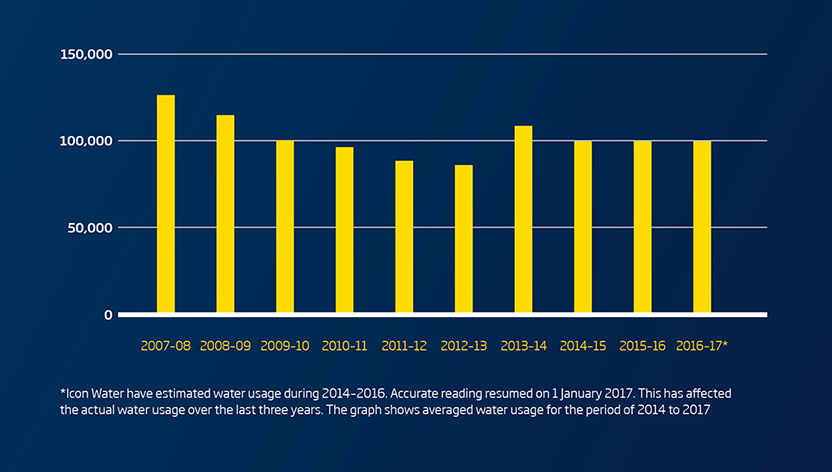
Water consumption
| Q1 | Q2 | Q3 | Q4 | Total Water Consumption | |
|---|---|---|---|---|---|
| 2007-08 | 127938 | 127938 | 119126 | 8812 | 127938 |
| 2008-09 | 115022.6 | 115022.6 | 107247.6 | 7775 | 115022.6 |
| 2009-10 | 98910 | 98910 | 89436 | 9474 | 98910 |
| 2010-11 | 94851 | 94851 | 84493 | 10358 | 94851 |
| 2011-12 | 89710 | 89710 | 81225 | 8485 | 89710 |
| 2012-13 | 87067 | 87067 | 81261 | 5806 | 87067 |
| 2013-14 | 109338 | 109338 | 103405 | 5933 | 109338 |
| 2014-15 | 97021.479 | 61233 | 61233 | 6284 | 67517 |
| 2015-16 | 97049.479 | 87578.44 | 87578.44 | 6312 | 93890.44 |
| 2016-17* | 96910.479 | 123401 | 123401 | 6173 | 129574 |
*Icon Water have estimated water usage during 2014-2016. Accurate reading resumed on 1 January 2017. This has affected the actual water usage over the last three years.The graph shows averaged water usage for the period of 2014 to 2017.
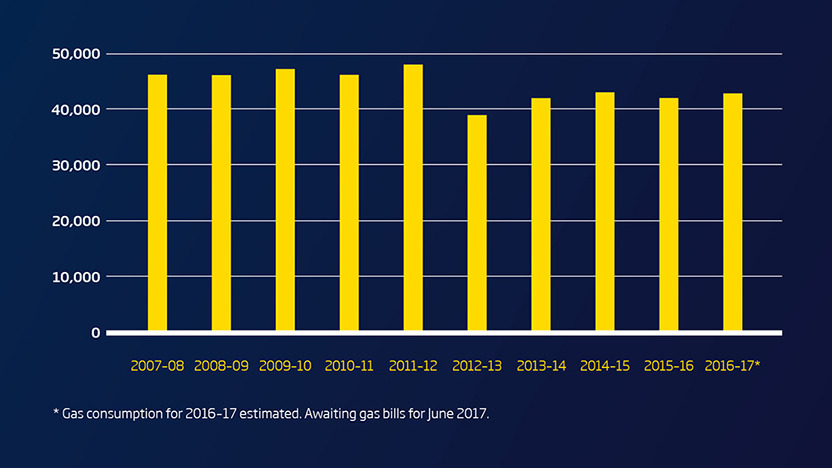
Gas consumption
| 2007-08 | 2008-09 | 2009-10 | 2010-11 | 2011-12 | 2012-13 | 2013-14 | 2014-15 | 20015-16 | 2016-17* | |
|---|---|---|---|---|---|---|---|---|---|---|
| July | 7132.134 | 5902.323 | 6890.033 | 6447.119 | 7055.679 | 6018.42 | 6186.96 | 6239.7 | 6607.91 | 5943.99 |
| August | 6350.81 | 5752.852 | 6281.686 | 6295.851 | 5810.276 | 5957.1 | 5807.26 | 5842.74 | 6282.13 | 5806.8 |
| September | 4914.405 | 4768.121 | 4931.197 | 4716.709 | 4957.16 | 4262.45 | 3592.65 | 4548.81 | 4806.62 | 4741.65 |
| October | 3499.202 | 3640.705 | 4593.108 | 3432.379 | 3593.28 | 3424.39 | 3342.61 | 3421.96 | 2760.74 | 4020.45 |
| November | 2712.553 | 3176.166 | 2312.696 | 2599.015 | 2259.46 | 2093.75 | 2722.56 | 2084.86 | 2225.42 | 2468.02 |
| December | 2466.531 | 2567.113 | 1990.369 | 2192.046 | 2451.56 | 1668.83 | 1903.28 | 1640.77 | 1724.95 | 1588.97 |
| January | 1735.878 | 1761.497 | 1533.279 | 1419.929 | 2028.2 | 1191.52 | 1682.65 | 1577.57 | 1741.16 | 1270 |
| February | 2086.357 | 1928.863 | 1544.849 | 1602.694 | 2044.97 | 1364.91 | 1585.82 | 1379.43 | 1488.01 | 1507 |
| March | 2297.492 | 2266.626 | 2524.15 | 2334.694 | 2860.85 | 1802.43 | 2114.38 | 2124.64 | 1951.45 | 1868 |
| April | 3620.19 | 3469.458 | 3309.142 | 3355.964 | 3448.37 | 2709.901 | 2782.97 | 3451.15 | 2460.46 | 3202.11 |
| May | 4563.353 | 4635.517 | 5204.156 | 5408.637 | 5269.16 | 3667.49 | 4213.65 | 4801.29 | 3990.48 | 5122.333 |
| June | 4683.118 | 5680.556 | 5919.068 | 5945.653 | 5712.21 | 4637.33 | 5426.94 | 5744.72 | 5410.05 | 5410.05 |
| Annual Water Consumption | 46062.023 | 45549.8 | 47033.73 | 45750.69 | 47491.18 | 38798.52 | 41361.73 | 42857.64 | 41449.38 | 42949.37 |
* Gas consumption for 2016-17 estimated. Awaiting gas bills for June 2017.
- 11.4% decrease in electricity usage compared to 9-year average
- 4.9% decrease in natural gas usage compared to 9-year average
- 2.5% decrease in water consumption compared to 9-year average
- 940 kilograms of waste processed through 48m2 worm farm each week.